
I've debugged race conditions. I've chased memory leaks across three microservices. I've stared at flame graphs at midnight trying to figure out why a perfectly healthy-looking service was silently failing a third of its requests.
But nothing quite prepared me for the moment I looked at a queue state dump and saw a job that had been marked active for over a week.
Not failed. Not stuck in a retry loop. Active. Alive. As if it was still happily processing away, just taking its time.
This is the story of the zombie worker — a job that never crashed, never completed, and held its BullMQ lock for seven days without anyone noticing. It's a debugging story, but more importantly it's a story about the assumptions we silently build into distributed systems and what happens when reality quietly violates all of them at once.
The Setup
The system involved two microservices. One was responsible for enqueueing jobs onto a queue whenever certain conditions were met. The other — the worker service — sat on the other end, pulling jobs, running a pipeline involving a handful of HTTP calls and some database writes, and completing them. Standard stuff. BullMQ on top of Redis. The kind of architecture you deploy, forget about, and move on.
Everything looked healthy. Both services had been running in staging for a while, logging green, no error alerts firing. The kind of calm that makes you trust a system.
Then came the smoke testing.
Something's Wrong. Nothing's Obviously Wrong.
The intended results of the worker pipeline weren't showing up in the app. Not "showing wrong results" — just nothing. Like the pipeline hadn't run at all.
My first instinct: the enqueueing service must be broken. Simple. Clean. Wrong.
I SSH'd into the enqueuing service and checked the logs. Jobs were being enqueued fine — timestamps recent, no errors, everything exactly as expected. Okay, so the jobs are in the queue. I pointed at the worker service next.
What I saw in the logs genuinely stopped me.
The worker service was active. No crashes. No error floods. The logs looked perfectly healthy — except they were a week old. The last real log entry was seven days ago. Since then: silence.
My first read was a log rotation issue, or maybe a misconfigured log driver not flushing. I restarted the containers. Redeployed. Re-enqueued the jobs manually.
Nothing changed. The new jobs weren't being picked up. The results still weren't appearing. A colleague who'd seen similar symptoms before suggested it might be a BullMQ worker state issue — stale Redis state, a misaligned lock, the kind of thing you fix by blowing away the containers and starting fresh. I'd done that before and it had worked. I did it again.
Still nothing.
That's when I stopped guessing and started debugging properly.
Writing the Script That Changed Everything
I wrote a small diagnostic script to pull the full state of the queue directly from Redis — not the app logs, not the dashboard, the raw queue internals. Waiting jobs, delayed jobs, completed jobs, failed jobs, and active jobs.
The output hit me like a wall.
Seven days. One job. Active.
47 jobs waiting behind it — the ones I had just enqueued, and all the ones before them. None of them being touched. And this single ancient job, sitting at the front of the queue like a bouncer who'd fallen asleep and wouldn't let anyone past.
Why BullMQ Wouldn't Let Me Touch It
My next instinct was to forcibly remove the job. Delete it, move on, figure out why later.
BullMQ wouldn't let me. The job was locked.
This is by design, and once you understand it, it's actually clever. When a BullMQ worker picks up a job, it acquires a lock on that job in Redis with a TTL — typically 30 seconds. As long as the worker process is alive and processing, it renews this lock on a regular heartbeat interval. This prevents two workers from ever processing the same job simultaneously.
The implication: if the lock is being continuously renewed, BullMQ assumes the worker is legitimately processing the job. It will not allow another worker to take it. It will not allow external deletion without force-removing it. From BullMQ's perspective, everything is fine — the worker is alive, the lock is healthy, the job is being worked on.
Which meant the worker process was alive. The Node.js event loop was running. The heartbeat was firing. Something in the pipeline had been awaiting for seven days without the process dying, the lock expiring, or anything throwing an error loud enough to surface.
The Code Audit: Looking in All the Wrong Places
I pulled up the processor function. The pipeline was straightforward:
- 01Parse job data
- 02A few database reads and writes
- 03Several HTTP calls via a rotation proxy client
- 04Write the results to the DB
- 05Mark complete
I started with the database operations. I tested them end-to-end locally, ran the pipeline a few times — everything worked. No hangs, no slow queries, no connection issues. Clean.
Then I looked at the HTTP calls. And here's where I made the first mistake: I dismissed them.
The code looked airtight. Axios with timeout configured. Try/catch wrapping every call. Error handling that logged failures and moved on. On paper it was exactly what you'd write if someone asked "how do you write a defensive HTTP call in Node.js?"
I moved on. I tried to replicate the issue locally, ran the pipeline probably a dozen times. It never hung. It never failed in any interesting way. I was starting to feel genuinely stuck.
The Logs Don't Lie, If You Read Them Long Enough
I went back to the worker logs. Not the recent ones — the old flood from staging, from the days around when the zombie job started. I scrolled through line by line.
Buried in the noise: a handful of ECONNRESET and ECONNABORTED errors. These were expected — the destination server was known to drop connections occasionally. They were being caught, logged, and the proxy client was rotating to another exit node. Nothing unusual.
But then, nothing. After those error lines — silence. No "retrying," no "request completed," no follow-up. The pipeline logs just... stopped.
The job was still active. The process was still alive. But nothing was being logged.
Which meant only one thing: somewhere after those connection errors, the code was awaiting a Promise that was never going to resolve or reject.
The Real Culprit: A Socket That Hung Below Axios
Here's what had actually happened, and it took a GitHub issue and a few Stack Overflow threads to piece together properly.
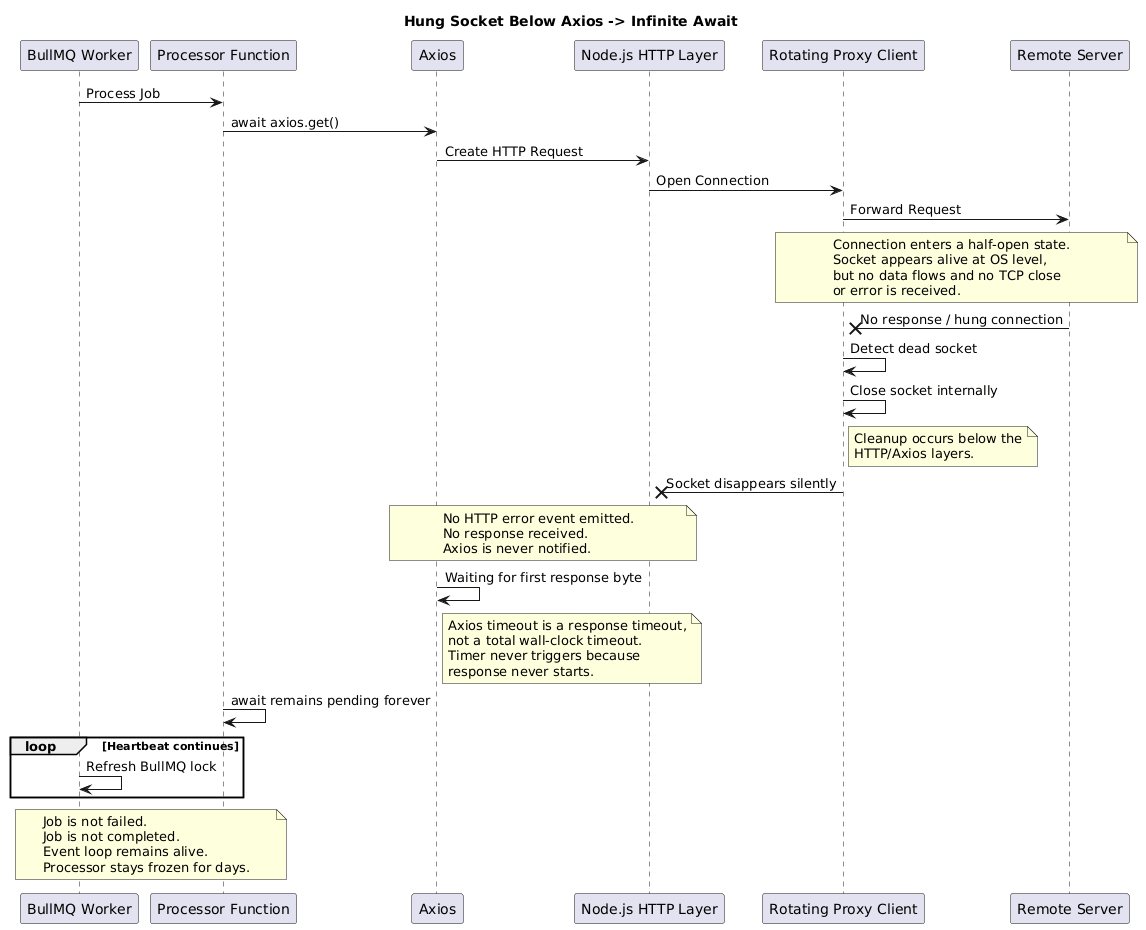
The rotation proxy client had encountered a low-level socket hang. Not a clean connection refusal. Not a proper TCP close. A half-open socket state — the kind where the connection appears to be alive at the OS level, but no data is flowing and no termination signal was ever cleanly received.
The proxy client, detecting this, closed and rejected the request at the socket layer — below the HTTP layer, and critically, below where Axios was watching.
The result: the socket was gone. But Axios never heard about it.
This is the crux of a known behavior in Axios that isn't obvious from the docs. The timeout option in Axios config starts a timer — but that timer measures from when the request is made until the first byte of the response arrives. It is not a wall-clock timeout for the entire request lifecycle. It does not guard against a hung socket that never sends a response at all.
Axios's timeout is a response timeout — it measures how long before the server starts sending a response. It is not a total request timeout. A socket that hangs at the TCP level, sending nothing, before a response even begins — that can wait forever. The timer never starts because there's no response to time.
The GitHub issue that confirmed it: axios/axios#5681
The socket had hung. The proxy had silently cleaned it up. Node.js never got an error event on the HTTP layer. Axios was still waiting for a response that would never come. The await in our processor function had been frozen — not crashed, not errored — frozen — for seven days.
And the BullMQ heartbeat kept refreshing the lock, because the event loop was still alive, just... waiting.
Visualizing the Failure
The Fix: AbortController, Proper Timeouts, and Defensive Everything
The Axios docs suggest using AbortController for precise cancellation control. After this incident, I understood exactly why.
AbortController works at a different level. It doesn't wait for a response timer to expire — it actively cancels the underlying request and rejects the Promise, regardless of what the socket or HTTP layer is doing. It's the escape hatch that Axios's internal timeout mechanism doesn't provide.
Here's the fixed version:
The AbortController timeout is unconditional. Whether the socket hangs, the proxy drops the connection silently, or the server just never responds — after 30 seconds, the Promise rejects. The pipeline moves forward. The job fails loudly instead of waiting in limbo forever.
Use both axios timeout and AbortController together. They guard different failure modes. Axios timeout catches slow responses. AbortController catches everything that happens before the response begins — including hung sockets. Defence in depth.
Cancelling a Locked BullMQ Job (The Fun Part)
Once I understood what was wrong, I still had to deal with the zombie job itself. And here's a fun detail: BullMQ doesn't have a clean built-in way to cancel an actively running job.
There's job.remove() for jobs that aren't locked, and queue.obliterate() for nuking the whole queue. But for a locked, actively-processing job? You're on your own.
So I wrote it myself:
It's not elegant. But it works. The job moved to failed, the 47 waiting jobs started processing, and within minutes the pipeline results started appearing in the app.
The Aftermath: What Changed
Beyond the AbortController fix, we made three other changes that I'd now consider non-negotiable for any worker system:
1. BullBoard for queue visibility
I deployed BullBoard — a UI for inspecting and managing BullMQ queues. Before this incident, the only way to check queue state was to SSH in and write a script. Now there's a dashboard. Active jobs, their age, retry counts, failed job payloads — all visible without touching a terminal.
If I'd had BullBoard running during staging, I'd have seen the zombie job on day one instead of day seven.
2. Success alerts, not just error alerts
This is the change I'm most embarrassed we didn't have before. We had error alerting — if the worker threw, we'd hear about it. But we had no alerting for absence of success. No "the pipeline hasn't completed a job in X hours" alert. No daily throughput report. Nothing that would catch a worker that was alive but not completing anything.
A simple daily summary would have surfaced this on day two.
3. Job-level timeout at the processor layer
Beyond fixing the individual HTTP call, we added a hard wall-clock timeout at the BullMQ processor level itself:
A watchdog. If any job — regardless of what it's doing internally — runs longer than five minutes, it gets force-failed and a loud alert fires. No job should ever last seven days silently again.
What This Was Really About
The zombie worker wasn't a bug in BullMQ. It wasn't a bug in Axios, exactly. It was a gap between two systems' failure assumptions — a socket-level failure that one layer cleaned up silently and another layer never heard about, leaving a Promise suspended indefinitely in between.
These are the hardest bugs to catch because no individual component is misbehaving. Each one is doing what it was designed to do. The failure lives in the interface between them.
The lesson I carry from this:
- Distributed systems fail at the seams. The most dangerous bugs aren't inside your code — they're in the assumptions your code makes about the systems it's talking to.
- Liveness isn't correctness. A process that's alive and not crashing is not the same as a process that's making progress. You need observability on throughput, not just uptime.
- Every await is a promise you're trusting something external to keep. Make sure you have an unconditional escape hatch on every one of them. AbortController is yours for HTTP calls. Make sure you have equivalents everywhere else.
The forty-seven jobs that had been waiting behind that zombie ran within the hour. The pipeline completed. The results appeared. Seven days of silence, resolved in an afternoon once we knew where to look.
The next time someone tells me their worker looks healthy, I ask one question: how long has the current active job been running?